Digital bone augmentation in posterior mandibles: A retrospective CBCT study and proposal of a 2-step bone augmentation protocol
June 14, 2019 / Categories: Digital Dentistry, Implant Dentistry
Asa'ad, Farah

Ferrantino, Luca

Testori, Tiziano

Consonni, Dario
Abstract
Objective
The objective was to analyze bone resorption patterns in posterior mandibles and the dimensions of their corresponding digital bone grafts. This could allow the fabrication of bone grafts with standardized dimensions that can be applied in the majority of clinical cases.
Materials and methods
Cone beam computed tomography scans (n = 120) were analyzed to evaluate the frequency of Cawood and Howell (C&H) classes. The most frequent class needing bone augmentation was virtually regenerated using specific software. Dimensions of the grafts were calculated.
Results
Class V was the most frequent atrophic class needing augmentation in posterior mandibles (20.4%). Severe atrophic stages were more frequent in females (adjusted P value = 0.001), in older people (adjusted P value = 0.31) and in the right mandible (adjusted P value = 0.03). After virtual regeneration of Class V cases (n = 36), 3 clusters based on the number of missing teeth were evident. The mean length of the grafts was 20 mm when 2 teeth were missing (reference), 23.9 mm in the case of 3 missing teeth (P < 0.001) and 29.6 mm for 4 missing teeth (P < 0.001). Height and width were comparable across the 3 clusters (P-values = 0.39–0.93). The mean graft volume was 1,469 mm3 in the case of 2 missing teeth (reference), 1,814 mm3 for 3 missing teeth (P = 0.001) and 2,177 mm3 for 4 missing teeth (P < 0.001). These volumes corresponded to those of soft-tissue expanders, suggesting the possibility of a 2-step augmentation protocol: soft-tissue expansion, followed by regeneration with prefabricated grafts of the corresponding volume.
Conclusion
Class V was the most frequent resorption pattern requiring augmentation in posterior mandibles. Virtual regeneration revealed 3 clusters of grafts, differing only in length based on the number of missing teeth. A 2-step augmentation protocol is proposed using soft-tissue expanders and prefabricated grafts with corresponding volumes. This protocol might be more applicable in the right mandible, females and older patients.
Keywords
Mandible; alveolar bone grafting; bone graft; cone beam computed tomography; soft-tissue expansion.
Introduction
To ensure a successful dental implant therapy, the presence of adequate amounts of vertical and horizontal alveolar bone is fundamental.1Javed F, Ahmed HB, Crespi R, Romanos GE. Role of primary stability for successful osseointegration of dental implants: factors of influence and evaluation. → Interv Med Appl Sci. 2013 Dec;5(4):162–7. Therefore, horizontal and/or vertical alveolar bone augmentation procedures are performed whenever the alveolar bone volume is inadequate.
Although horizontal and vertical bone augmentation procedures are both technique-sensitive, the latter is more challenging and several surgical techniques are applied, such as vertical guided bone regeneration, onlay grafting, inlay grafting and distraction osteogenesis. 2Rocchietta I, Fontana F, Simion M. Clinical outcomes of vertical bone augmentation to enable dental implant placement: a systematic review. → J Clin Periodontol. 2008 Sep;35(8 Suppl):203–15.,3Esposito M, Grusovin MG, Felice P, Karatzo-Poulos G, Worthington HV, Coulthard P. Interventions for replacing missing teeth: horizontal and vertical bone augmentation techniques for dental implant treatment. → Cochrane Database Syst Rev. 2009 Oct 7;(4):CD003607. doi: 10.1002/14651858. CD003607.pub4. As is known, vertical bone augmentation is frequently associated with high rates of complications, such as soft-tissue dehiscence and subsequent exposure of bone grafts in the oral cavity.4Jensen SS, Terheyden H. Bone augmentation procedures in localized defects in the alveolar ridge: clinical results with different bone grafts and bone-substitute materials. → Int J Oral Maxillofac Implants. 2009;24 Suppl:218–36. Consequently, soft-tissue expansion (STE) has been introduced, to enhance the quantity and quality of soft tissue prior to bone augmentation procedures, by using self-inflating soft-tissue expanders (for a review, see Asa’ad et al.5Asa’ad F, Rasperini G, Pagni G, Rios HF, Giannì AB. Pre-augmentation soft tissue expansion: an overview. → Clin Oral Implants Res. 2016 May;27(5):505–22.). STE facilitates passive closure of the flap, thus decreasing patient morbidity and improving regenerative outcomes.
With the introduction of solid freeform fabrication techniques, researchers became interested in developing custom-made bone grafts with complex architectures6Moroni L, De Wijn JR, Van Blitterswijk CA. 3D fiber- deposited scaffolds for tissue engineering: influence of pores geometry and architecture on dynamic mechanical properties. → Biomaterials. 2006 Mar;27(7):974–85. that conform better to more complex defects, thus increasing the predictability of regenerative outcomes, especially in complex defect areas and in posterior mandibles, as the rehabilitation of this edentulous area with dental implants is very challenging for clinicians in modern dental practice.7Laino L, Iezzi G, Piattelli A, Lo Muzio L, Cicciù M. Vertical ridge augmentation of the atrophic posterior mandible with sandwich technique: bone block from the chin area versus corticocancellous bone block allograft— clinical and histological prospective randomized controlled study. → Biomed Res Int. 2014;2014:982104. doi: 10.1155/2014/982104. Such systems utilize computer-aided design (CAD) and computeraided manufacturing (CAM) technologies to 3-D print a desired structure based on a CAD file that contains the already determined graft dimensions.8Yeong WY, Chua CK, Leong KF, Chandrasekaran M. Rapid prototyping in tissue engineering: challenges and potential. → Trends Biotechnol. 2004 Dec;22(12):643–52. In a typical clinical case scenario, CAD models are produced based on images from computed tomography (CT) scans of a patient-specific bone defect to develop a custom-made synthetic graft to regenerate defects with complex geometry9Ma PX. Biomimetic materials for tissue engineering. → Adv Drug Deliv Rev. 2008 Jan 14;60(2):184–98. (for a review, see Asa’ad et al.10Asa’ad F, Pagni G, Pilipchuk SP, Giannì AB, Giannobile WV, Rasperini, G. 3D-printed scaffolds and biomaterials: review of alveolar bone augmentation and periodontal regeneration applications. → Int J Dent. 2016;2016:1239842. doi: 10.1155/2016/1239842.).
Recently in the literature, a case series focused on the concept of custom-made grafts and minimally invasive surgical procedures for alveolar bone regeneration using subtractive technologies, that is, milling of a commercially available block using CAD/CAM technologies.11Venet L, Perriat M, Mangano FG, Fortin T. Horizontal ridge reconstruction of the anterior maxilla using customized allogeneic bone blocks with a minimally invasive technique—a case series. → BMC Oral Health. 2017 Dec 8;17(1):146. doi: 10.1186/s12903-017-0423-0. Nonetheless, creating a customized bone graft for every clinical case could be of very high cost, mainly owing to the required armamentarium and setup. In this regard, providing standardized prefabricated synthetic bone grafts that can be applied in most clinical case scenarios with minimal chairside modifications might be a more cost-effective alternative. This concept was previously investigated by Metzger et al., who evaluated the topographical anatomy of the human orbital floor for the production of prefabricated implants on the basis of data obtained from conventional CT.12Metzger MC, Schön R, Tetzlaf R, Weyer N, Rafii A, Gellrich NC, Schmelzeisen R. Topographical CT-data analysis of the human orbital floor. → Int J Oral Maxillofac Surg. 2007 Jan;36(1):45–53.
Therefore, the aim of the present retrospective study was to analyze bone resorption patterns in right and left posterior mandibles and the corresponding digital bone grafts, in a single population, to evaluate whether the grafts could be grouped into distinct clusters. We also present a preliminary analysis of the severity of bone resorption and number of missing posterior teeth in relation to age, sex and mandibular side. We also propose a 2-step bone augmentation protocol, entailing STE, followed by placement of a prefabricated bone graft of the corresponding volume.
Materials and methods
CBCT scans and inclusion criteria
An entire database (a total of 300 cone beam computed tomography [CBCT] scans dated from 2011 to 2016) of a private dental practice in Como, Italy, was accessed during the period of April–June 2016. All the CBCT scans were generated by the same CBCT equipment (Planmeca ProMax 3D Max, Planmeca, Helsinki, Finland) with the following exposure settings: 90 kV and 8 mA or 10 mA for 12 – 15 seconds.
After all the scans were screened, only 120 scans met the inclusion criteria, and thus were selected for the final analysis. As a routine protocol, all the patients signed an informed consent form agreeing to the use of their data for scientific purposes. All patients were treated according to the principles contained in the Declaration of Helsinki of 1980 for biomedical research involving human subjects. Screening of scans and selection were performed by the same investigator (FA).
The final CBCT scans met the following inclusion criteria:
- Scans had to be of patients of 35 years of age or older. The cutoff point for inclusion was set at 35 years of age based on the finding in the literature that peak bone density is reached by age 35,13Sezer A, Altan L, Özdemir Ö. Multiple comparison of age groups in bone mineral density under heteroscedasticity. → Biomed Res Int. 2015;2015:426847. doi: 10.1155/2015/426847. after which bone density/mass starts to decrease.
- Scans had to be of patients without any reported systemic diseases that affect bone (e.g., osteoporosis), as verified from patients’ records.
- At least 1 side of the posterior mandible had to be either partially or fully edentulous.
- The edentulous area had to have at least 2 consecutive posterior missing teeth, 1 of them a molar, as follows: (i) missing first and second molars (2 teeth); (ii) missing second premolar and first and second molars (3 teeth); and (iii) missing first and second premolars and first and second molars (4 teeth).
- Alveolar bone resorption had to be physiological after tooth loss/extraction and not related to any trauma or pathologies, as verified from patients’ records.
The CBCT scan exclusion criteria were the following:
- Patients who reported systemic diseases that would affect the alveolar bone, for example osteoporosis.
- History of previous bone grafting procedures, as this variable affects bone morphology.
- Sole presence of edentulous maxillary sextants, as the upper jaw was not the region of interest in this retrospective study. It must be noted that the posterior mandible was selected as the region of interest because its rehabilitation is considered the most challenging for clinicians in modern dental practice.14Laino L, Iezzi G, Piattelli A, Lo Muzio L, Cicciù M. Vertical ridge augmentation of the atrophic posterior mandible with sandwich technique: bone block from the chin area versus corticocancellous bone block allograft— clinical and histological prospective randomized controlled study. → Biomed Res Int. 2014;2014:982104. doi: 10.1155/2014/982104.
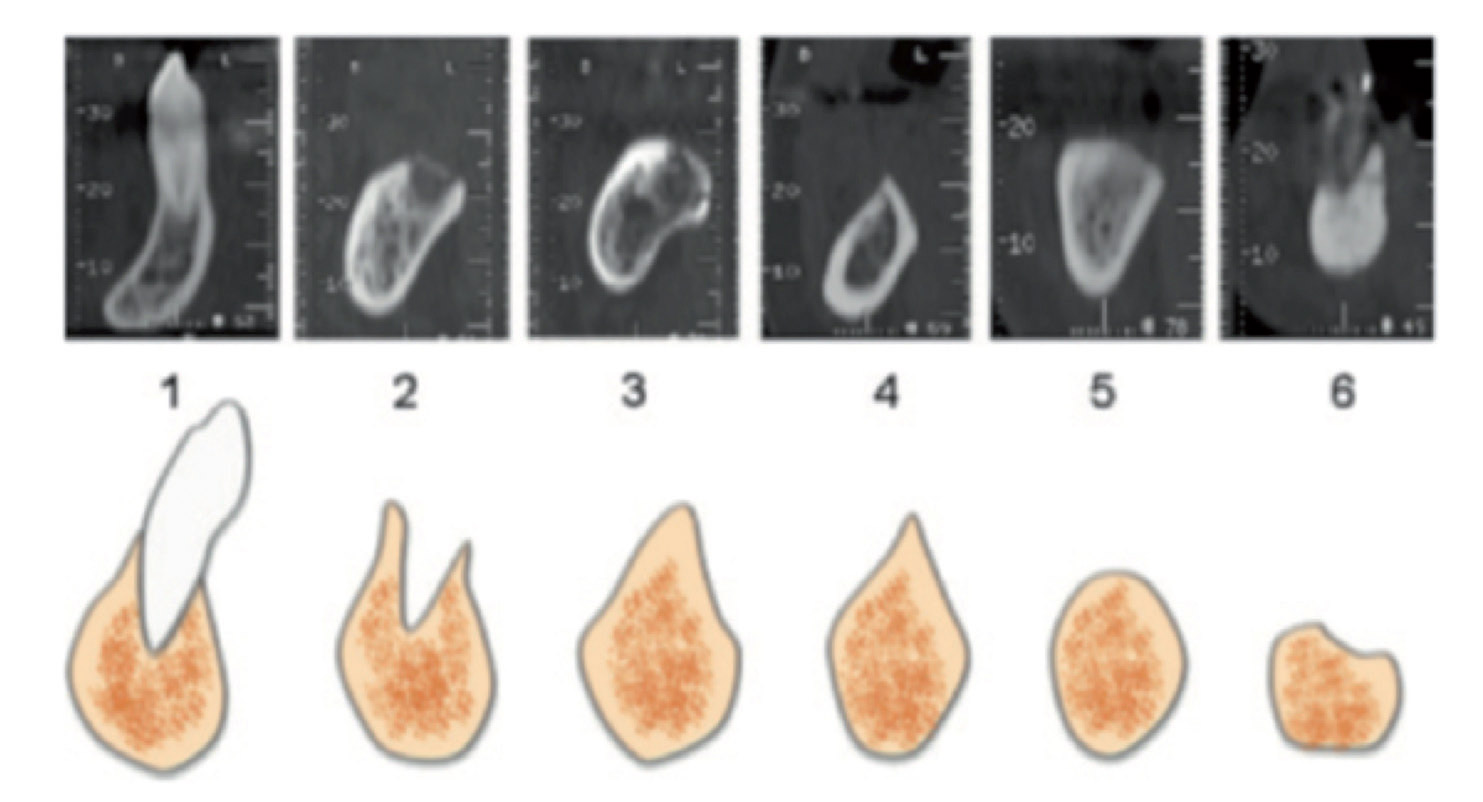
Fig. 1
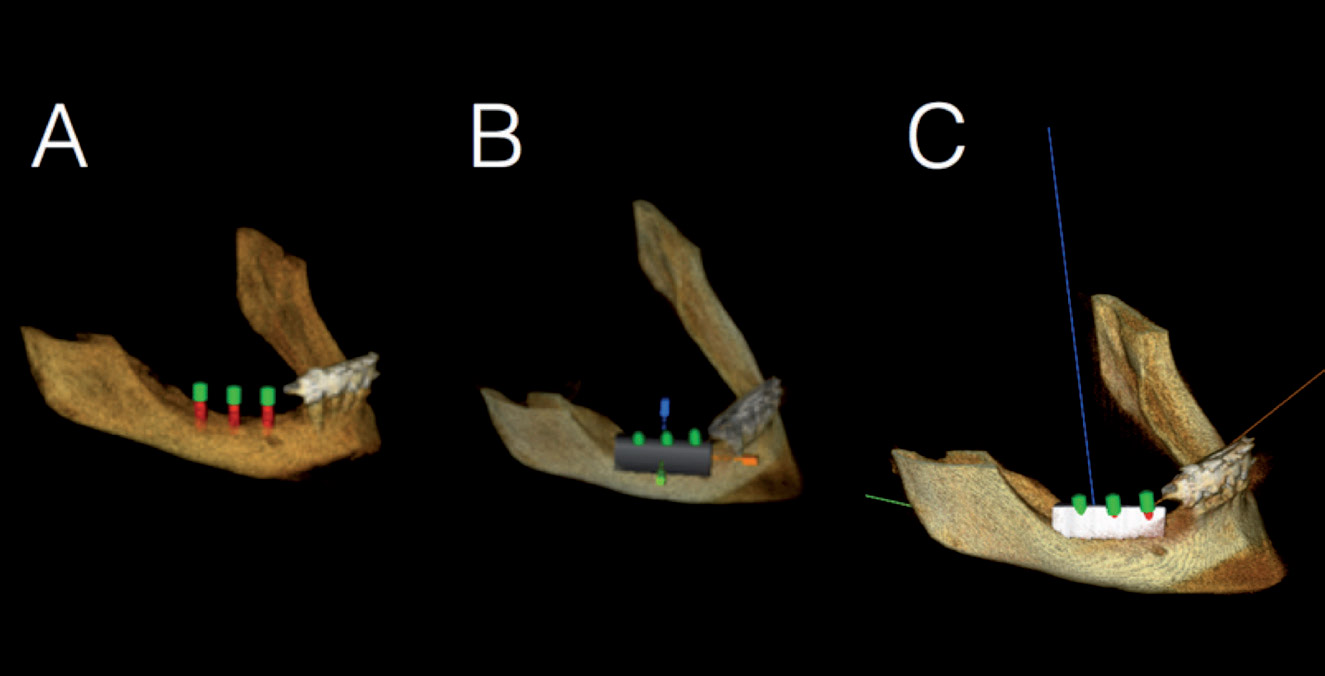
Fig. 2a
For the final 120 scans, each included at least 1 side of the posterior mandible that met the inclusion criteria for analysis. Afterward, the contralateral mandibular side was assessed as well. If it met the inclusion criteria, it was also included in the final analysis, but if not, that segment was excluded. It must be noted that, in that case, the segment was excluded from the overall frequency analysis and not the scan. The contralateral segment was eliminated from the final analysis if it had 1 of the following characteristics:
- fully dentate arch (Cawood and Howell Class I);
- nonconsecutive missing posterior teeth;
- 1 missing posterior tooth;
- 2 missing premolars;
- bounded saddle areas consisting of a missing second premolar and missing first molar (first premolar and second molar were present); and
- edentulous area already restored with dental implants.
Analysis of mandibular bone resorption patterns on CBCT scans
The pattern of the mandibular bone loss was assessed by the same examiner (FA), using the classification proposed by Cawood and Howell (C&H).15Cawood JI, Howell RA. A classification of the edentulous jaws. → Int J Oral Maxillofac Surg. 1988 Aug;17(4):232–6. This classification system is among the most widely used to categorize edentulous ridges.16Rossetti PH, Bonachela WC, Rossetti LM. Relevant anatomic and biomechanical studies for implant possibilities on the atrophic maxilla: critical appraisal and literature review. → J Prosthodont. 2010 Aug;19(6):449–57. The ridge displays a specific shape during different phases of bone resorption that can be clearly identified on CBCT scans (Fig. 1).17Saavedra-Abril J, Balhen-Martin C, Zaragoza-Velasco K, Kimura-Hayama ET, Saavedra S, Stoopen ME. Dental multisection CT for the placement of oral implants: technique and applications. → Radiographics. 2010 Nov;30(7):1975–91. The C&H classification divides the posterior mandible into 6 groups as follows:
- Class I: dentate;
- Class II: immediately post-extraction;
- Class III: well-rounded ridge form, adequate in height and width;
- Class IV: knife-edge ridge form, adequate in height and inadequate in width;
- Class V: flat ridge form, inadequate in height and width;
- Class VI: depressed ridge form with some basal loss evident. Frequency analysis of bone resorption patterns was done using DICOM files imported into OS3D 2.0 software (3DMed, L’Aquila, Italy).
Frequency analysis of bone resorption pattern and number of missing teeth were compared for age, sex and mandibular side.
Virtual bone regeneration and digital bone grafts
Virtual regeneration with digital bone grafts was performed after the frequency analysis had been completed. This step was only done for the most frequent C&H class requiring bone augmentation (i.e., the most frequent class among Classes IV, V and VI).
By means of imaging software (OS3D 2.0), the digital data were processed to obtain a 3-D image of the bone loss, and a virtual graft was designed, simulating a real bone grafting procedure (Fig. 2a), as described by Jacotti et al.18Jacotti M, Barausse C, Felice P. Posterior atrophic mandible rehabilitation with onlay allograft created with CAD-CAM procedure: a case report. → Implant Dent. 2014 Feb;23(1):22–8. The software allowed the determination of the length, height and width of each graft. The software also verified the intimate adaptation between the virtual graft and the underlying bone surface. As a guide for the virtual bone regeneration procedure, the residual bone height above the mandibular canal was measured, and then the virtual graft height was determined by the ability to accommodate an implant of a standard height (10 mm) with a 2 mm safety zone above the mandibular canal (Fig. 2b). Virtual graft width was determined by the ability to accommodate a 3.25 mm diameter dental implant. Virtual graft length was based on the number of missing consecutive posterior teeth. The 3-D planning software allowed for virtual dental implant placement, subsequent virtual bone regeneration and verification of the graft dimensions.
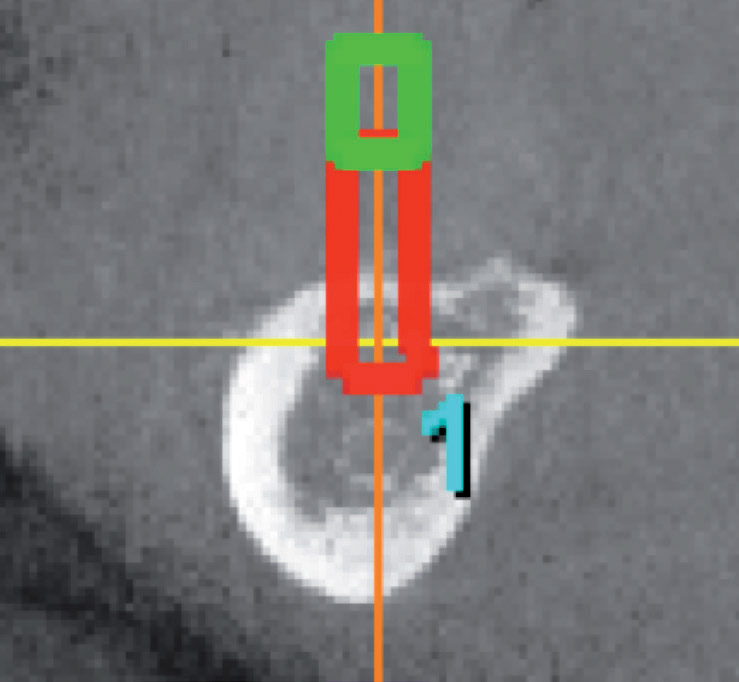
Fig. 2b
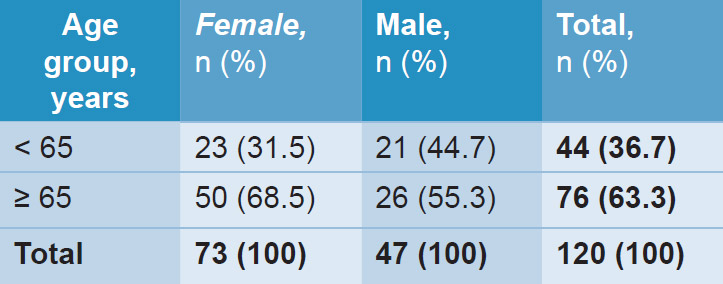
Table 1 Age and sex distribution of the study population.
Statistical analysis
Random intercept univariate and multivariable linear regression models were fitted to evaluate the effect of sex, age and side on the C&H classes, the number of missing teeth and dimensions of virtual grafts (length, height, width and volume). Statistical analyses were performed using Stata 15 (StataCorp).
Results
A total of 120 patients contributed 120 CBCT scans and 240 posterior mandibular segments. A total of 59 contralateral mandibular segments were excluded from the final analysis (25 in the left mandible and 34 in the right mandible), and 181 left and right mandibular segments were analyzed overall (95 in the left mandible and 86 in the right mandible). The study participants were 47 males and 73 females with an age range between 37 and 92 years (mean age = 66.2 ± 11.2 years; Table 1).
The study sample was divided into 2 age groups: < 65 years old and ≥ 65 years old. Most of the study participants were of the second age category (63.3%). For the purpose of this study, the results will focus on C&H classes that require alveolar bone augmentation (i.e., Classes IV, V and VI).
Frequency of bone loss patterns in posterior mandibles in relation to sex, age and side (Table 2)
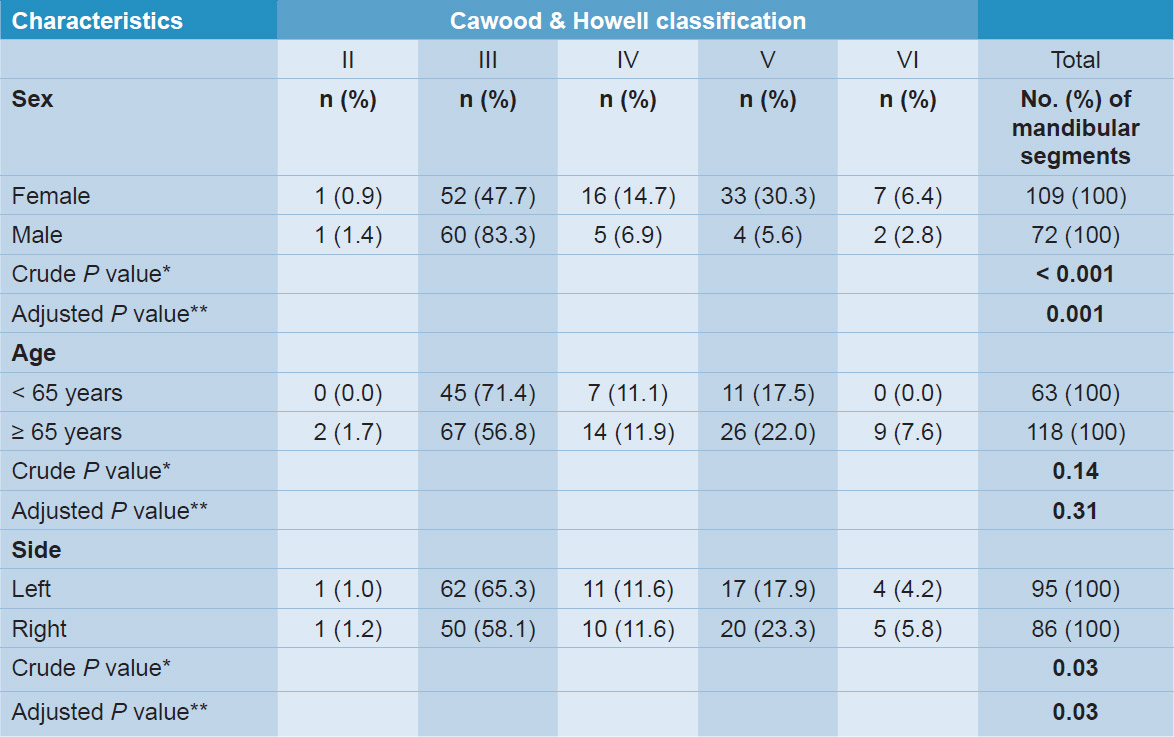
Females showed higher frequencies of Classes IV, V and VI in comparison with males (crude P value < 0.001; adjusted P value = 0.001). Class V was the most frequent class that requires augmentation in females (30.3%), while 5.6% of males had Class V in the posterior mandible. Class VI was the least frequent in relation to Classes IV and V in both sexes (6.4% in females; 2.8% in males).
Patients in the older age category showed higher frequencies of Classes IV, V and VI in comparison with younger patients (crude P value = 0.14; adjusted P value = 0.31). The most frequent class that requires augmentation was Class V in older (22.0%) and younger (17.5%) individuals.
In both mandibular sides, Class V was the most frequent class that requires augmentation in comparison with Classes IV and VI. However, Class V was more frequent in the right mandible than on the left side (23.3% and 17.9%, respectively; crude P value = 0.03; adjusted P value = 0.03).
Frequency of consecutively missing teeth in posterior mandibles in relation to sex, age and side (Table 3)
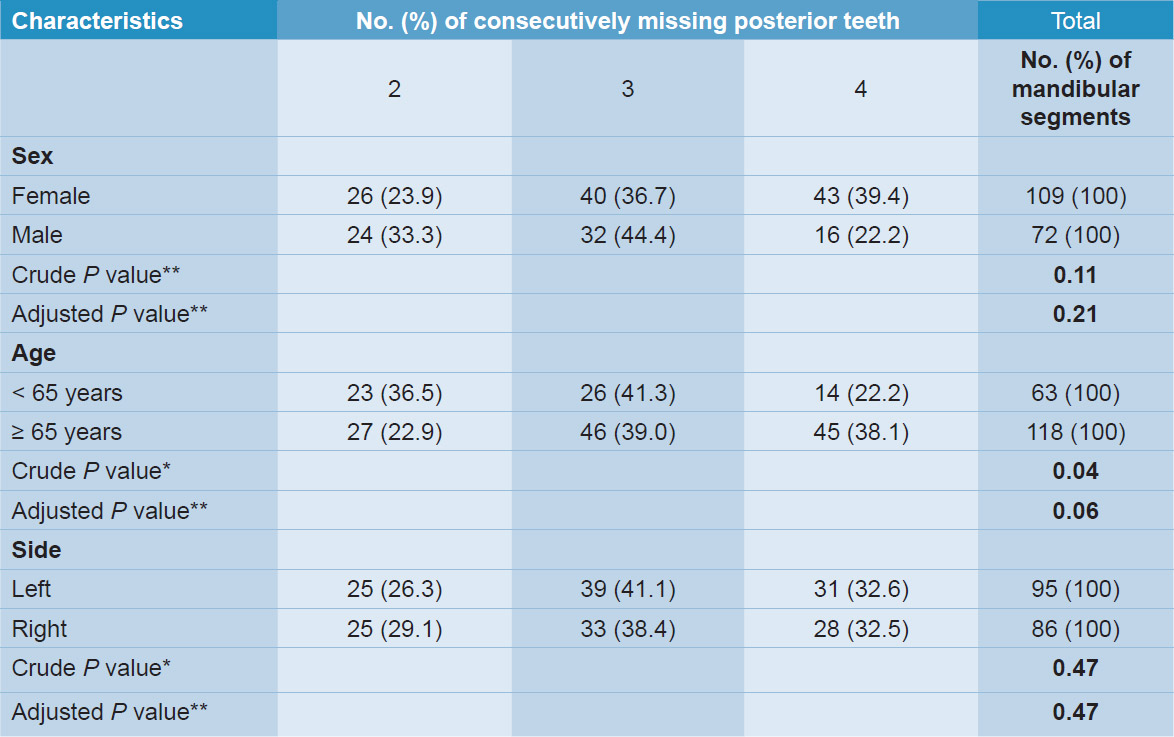
Most of the posterior mandibular segments in females had either 3 or 4 missing teeth (36.7%, 39.4%, respectively), while most of the mandibular segments in males showed 3 missing teeth (44.4%). Nonetheless, sex did not seem to influence the number of consecutive missing teeth in the posterior mandible (crude P value = 0.11; adjusted P value = 0.21).
* From random intercept univariate linear regression models.
** From random intercept multivariable linear regression models containing all three variables.
Table 2
Frequency of different bone loss patterns in posterior mandibles in relation to sex, age and side.
* From random intercept univariate linear regression models.
** From multivariable linear regression models containing all three variables.
Table 3
Frequency of consecutively missing teeth in posterior mandibles in relation to sex, age and side.
* From random intercept univariate linear regression models.
** From multivariable linear regression models containing all three variables.
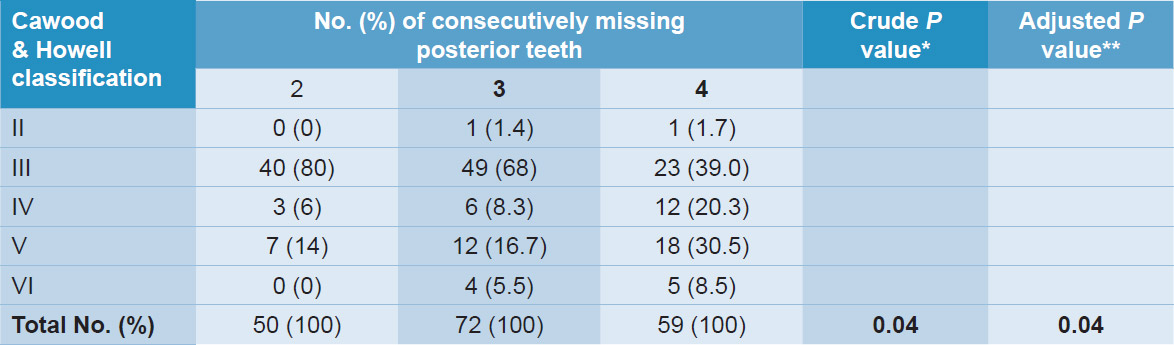
Table 4
Number of consecutive missing teeth in posterior mandibles in relation to Cawood and Howell classification.
* P values from random intercept linear regression models adjusted for sex, age and side.
Table 5
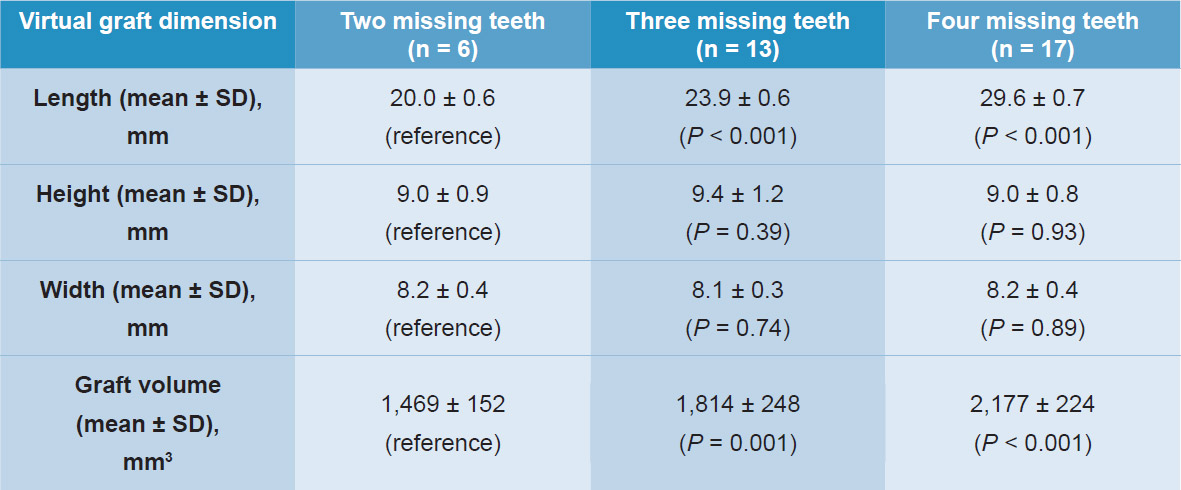
Height, width and length of virtual grafts of Cawood and Howell Class V.
Posterior mandibles in patients of ≥ 65 years of age showed mostly 3 or 4 missing teeth (39.0% and 38.1%, respectively), while the posterior segments in the younger age group showed mostly 2 or 3 missing teeth (36.5% and 41.3%, respectively). These results show that the number of missing teeth might be influenced by age (0.3 more missing teeth on average among older patients; crude P value = 0.04; P = 0.06, adjusted for sex and side).
Both right and left posterior mandibles had comparable frequencies of the number of missing teeth. Three missing teeth were the most frequent for both sides, while 2 missing teeth were the least frequent (crude P value = 0.47; adjusted P value = 0.47).
Frequency of consecutively missing teeth in posterior mandibles in relation to bone loss patterns (Table 4)
Posterior mandibles that showed Classes IV, V and VI had mostly 4 missing teeth. In Classes IV and V, the frequency of 2 and 3 missing teeth was almost comparable. None of the mandibles with Class VI had 2 missing teeth (crude P value = 0.04; adjusted P value = 0.04).
Dimensions of digital bone grafts for mandibular segments with Class V (Table 5)
As Class V was the most frequent among classes that require bone augmentation (i.e., the most frequent among Classes IV, V and VI), virtual bone regeneration of Class V mandibular segments was performed through digital bone grafts, using specific software. Among the 181 analyzed mandibular segments, 37 segments were of Class V. However, virtual bone regeneration was only performed for 36 segments, as 1 segment was excluded owing to technical difficulties encountered with the provided CBCT scan of the patient, which did not allow for the procedure to be successfully performed. Regarding the length of the virtual graft, the mean was 20 ± 0.6 mm when 2 teeth were missing. When 3 teeth were missing, the mean length was 23.9 ± 0.6 mm. In cases of both premolars and both molars missing, the mean length was 29.6 ± 0.7 mm. Mean length was different based on the number of missing teeth (P < 0.001). As for the width of the virtual graft, it was almost comparable when 2 (8.2 ± 0.4), 3 (8.1 ± 0.3) or 4 teeth (8.2 ± 0.4) were missing (P > 0.05). Regarding the height of the virtual graft, this dimension was also comparable when 2 (9.0 ± 0.9), 3 (9.4 ± 1.2) or 4 teeth (9.0 ± 0.8) were missing (P > 0.05).
Discussion
To the best of the authors’ knowledge, this is the first retrospective study to analyze the frequency of C&H classes on CBCT scans and virtually regenerate the most frequent atrophic class that requires bone augmentation. As findings in the literature are inconsistent regarding the severity of bone resorption in relation to sex, the frequency of C&H classes between males and females was compared in the present study as well. The C&H classification19Cawood JI, Howell RA. A classification of the edentulous jaws. → Int J Oral Maxillofac Surg. 1988 Aug;17(4):232–6. was applied in this retrospective analysis because it is among the most used to categorize edentulous ridges20Rossetti PH, Bonachela WC, Rossetti LM. Relevant anatomic and biomechanical studies for implant possibilities on the atrophic maxilla: critical appraisal and literature review. → J Prosthodont. 2010 Aug;19(6):449–57. and the different shapes of a ridge of each class can be easily identified on CBCT scans.21Saavedra-Abril J, Balhen-Martin C, Zaragoza-Velasco K, Kimura-Hayama ET, Saavedra S, Stoopen ME. Dental multisection CT for the placement of oral implants: technique and applications. → Radiographics. 2010 Nov;30(7):1975–91. To date, there is only 1 study that assessed the frequency of C&H atrophic stages. However, this investigation was in a historic nation and only evaluated the association between age and frequency/severity of atrophy.22Reich KM, Huber CD, Lippnig WR, Ulm C, Watzek G, Tangl S. Atrophy of the residual alveolar ridge following tooth loss in an historical population. → Oral Dis. 2011 Jan;17(1):33–44. After the frequency analysis of bone resorption patterns, dimensions of digital grafts were assessed as well, to determine whether the virtual grafts could be grouped into distinct clusters, which could allow the fabrication of bone grafts of standardized dimensions that could be applied in the majority of clinical cases.
The findings of the present study suggest that females show higher frequencies of severe atrophic stages in comparison with males; thus, sex tends to influence bone resorption. These results are consistent with what has been previously reported in the literature. Solar et al. suggested that female sex was an independent risk factor for more severe bone resorption in the mandible.23Solar P, Ulm CW, Thornton B, Matejka M. Sex-related differences in the bone mineral density of atrophic mandibles. → J Prosthet Dent. 1994 Apr;71(4):345–9. In another study, female sex was indicated as a risk factor for greater bone resorption in the posterior mandible;24Kordatzis K, Wright PS, Meijer HJ. Posterior mandibular residual ridge resorption in patients with conventional dentures and implant overdentures. → Int J Oral Maxillofac Implants. 2003 May–Jun;18(3):447–52. however, this study focused on patients wearing conventional dentures and implant overdentures. Interestingly, the tendency of females to show more bone resorption than their male counterparts might be due to females having deeper resorption lacunae.25Devlin H, Sloan P, Luther F. Alveolar bone resorption: a histologic study comparing bone turnover in the edentulous mandible and iliac crest. → J Prosthet Dent. 1994 May;71(5):478–81. In a different investigation, more severe resorption in females was due to lower bone mineral content of the mandible in young dentate women when compared with young dentate men.26Von Wowern N. Bone mineral content of mandibles: normal reference values—rate of age-related bone loss. → Calcif Tissue Int. 1988 Oct;43(4):193–8. As is known, the less highly mineralized a substrate is, the more easily it can resorb.27Jones SJ, Arora M, Boyde A. The rate of osteoclastic destruction of calcified tissues is inversely proportional to mineral density. → Calcif Tissue Int. 1995 Jun;56(6):554–8. In contrast, Winter et al. reported more bone loss in the posterior mandible in males, due to greater biting force.28Winter CM, Woelfel JB, Igarashi T. Five-year changes in the edentulous mandible as determined on oblique cephalometric radiographs. → J Dent Res. 1974 Nov–Dec;53(6):1455–67.
In the present retrospective analysis, C&H Class V was the most frequent among the 3 atrophic classes that require bone augmentation (i.e., Classes IV, V and VI) among all study participants, while Class VI was the least frequent. In a retrospective analysis of a historic nation, atrophy stages V and VI were both the most frequent among older age groups.29Reich KM, Huber CD, Lippnig WR, Ulm C, Watzek G, Tangl S. Atrophy of the residual alveolar ridge following tooth loss in an historical population. → Oral Dis. 2011 Jan;17(1):33–44. Since the population of the present retrospective analysis is not historic, the negligible frequency of class VI frequency can be justified by the fact that patients do seek dental treatment at some point before bone resorption progresses to basal bone. As expected, the older age group (≥ 65 years) in the current retrospective analysis showed more severe C&H classes of resorption in comparison with the younger age group (< 65 years). Similarly, in a historic nation, the severity of bone resorption was associated with the individual’s age.30Reich KM, Huber CD, Lippnig WR, Ulm C, Watzek G, Tangl S. Atrophy of the residual alveolar ridge following tooth loss in an historical population. → Oral Dis. 2011 Jan;17(1):33–44. Moreover, the results of the present study revealed that the number of missing teeth is influenced by age.
As Class V was the most frequent among the atrophic classes that require bone augmentation, all Class V cases were virtually regenerated with digital bone grafts. This procedure was guided by virtual implant placement, to ensure that the dimensions of the virtual grafts were correct. Based on these dimensions, 3 clusters were notable—graft length of 21, 25 and 30 mm—based on the number of missing teeth. In these clusters, graft width and height were almost comparable (8 mm and 9 mm, respectively). Therefore, it might be logical to propose that using prefabricated bone grafts in most clinical case scenarios could be practical and applicable. Utilization of prefabricated bone grafts could be more applicable in right mandibles in females and older patients, based on the results of the current study.
Whether the prefabricated graft may need minimal or major modification for adaptation is to be confirmed in a future study, by calculating and comparing the adaptation ratio of both the virtual and actual grafts. It has been suggested that shaping and modification of a chairside graft highly increase the risk of contamination and subsequent infection, which could compromise the outcomes of the bone regeneration procedure.31Jacotti M, Barausse C, Felice P. Posterior atrophic mandible rehabilitation with onlay allograft created with CAD-CAM procedure: a case report. → Implant Dent. 2014 Feb;23(1):22–8.
In the present study, the virtual bone augmentation procedure was guided by virtual placement of dental implants. One might argue that dental implants shorter than 10 mm can be used in posterior mandibles with predictable outcomes. Indeed, short dental implants are a valid option for restoring posterior mandibular regions, as is vertical bone augmentation combined with implants of standard length (i.e., 10 mm);32Lops D, Bressan E, Pisoni G, Cea N, Corazza B, Romeo E. Short implants in partially edentulous maxillae and mandibles: a 10 to 20 years retrospective evaluation. → Int J Dent. 2012;2012:351793. doi: 10.1155/2012/351793.,33Thoma DS, Cha JK, Jung UW. Treatment concepts for the posterior maxilla and mandible: short implants versus long implants in augmented bone. → J Periodontal Implant Sci. 2017 Feb;47(1):2–12. however, since the aim of the present study was to analyze the virtual graft dimensions, the second treatment option was adopted (i.e., vertical bone augmentation), and a virtual implant of standard length was used to guide the virtual bone augmentation procedure. Narrow implants (i.e., 3.25 mm) were used, as their successful application in the posterior mandible has been previously reported as a minimally invasive alternative to horizontal bone augmentation.34Grandi T, Svezia L, Grandi G. Narrow implants (2.75 and 3.25 mm diameter) supporting a fixed splinted prostheses in posterior regions of mandible: one-year results from a prospective cohort study. → Int J Implant Dent. 2017 Sep 8;3(1):43. doi: 10.1186/s40729-017-0102-6. Therefore, placing a virtual implant with a narrow diameter was done in order to decrease the horizontal bulkiness of the graft.
Although the current study suggests 3 different volumes of bone grafts based on the number of missing teeth, this aspect represents just 1 component of the entire clinical paradigm. In fact, case management is influenced by various factors that must be taken into consideration: the patient’s socio-economic status; application of the short dental arch concept; length, diameter and number of dental implants; and utilization of a removable prosthesis instead of implant therapy. Although one might think that the bone graft volumes generated might be insufficient at the time of implant surgery, as graft resorption during osseous healing is still not predictable, it must be noted that prefabricated grafts could be made of biomaterials that have a degradation rate in concordance with the remodeling processes of the target tissue.35Asa’ad F, Pagni G, Pilipchuk SP, Giannì AB, Giannobile WV, Rasperini, G. 3D-printed scaffolds and biomaterials: review of alveolar bone augmentation and periodontal regeneration applications. → Int J Dent. 2016;2016:1239842. doi: 10.1155/2016/1239842. In this context, a 2-step regenerative protocol can be implemented: pre-augmentation STE technique (Fig. 3),36Asa’ad F, Rasperini G, Pagni G, Rios HF, Giannì AB. Pre-augmentation soft tissue expansion: an overview. → Clin Oral Implants Res. 2016 May;27(5):505–22.,37Asa’ad F, Bellucci G, Ferrantino L, Trisciuoglio D, Taschieri S, Del Fabbro M. Preaugmentation soft tissue expansion: a report of four pilot cases. → Case Rep Dent. 2018 Apr 19;2018:3162617. doi: 10.1155/2018/3162617. followed by regeneration with prefabricated grafts. In this approach, a suitable self-inflating soft-tissue expander and its corresponding bone graft volume are chosen for each individual patient after thorough treatment planning of the case. The virtual graft volumes obtained in this retrospective study appear to correlate to the available soft-tissue expander volumes. For example, the mean virtual graft volume obtained when 4 posterior mandibular teeth were missing was 2,177 mm3. This corresponds to the 2.1 mL (2,100 mm3) final-volume expander. Therefore, utilizing an expander of this volume and the corresponding bone graft volume could be applicable in a Class V posterior mandible with 4 missing teeth. Likewise, the mean virtual graft volume when 3 teeth were missing was 1,814 mm3. The matching soft-tissue expander volume in this case would be either a 1.3 or a 2.1 mL final-volume expander. In the case of 2 missing teeth, the mean virtual graft volume was 1,469 mm3, suggesting that a 1.3 mL final-volume expander would be the most suitable in this clinical situation. However, future studies focused on soft-tissue expanders and their corresponding graft volumes are needed to confirm these preliminary findings and the benchmark values generated.
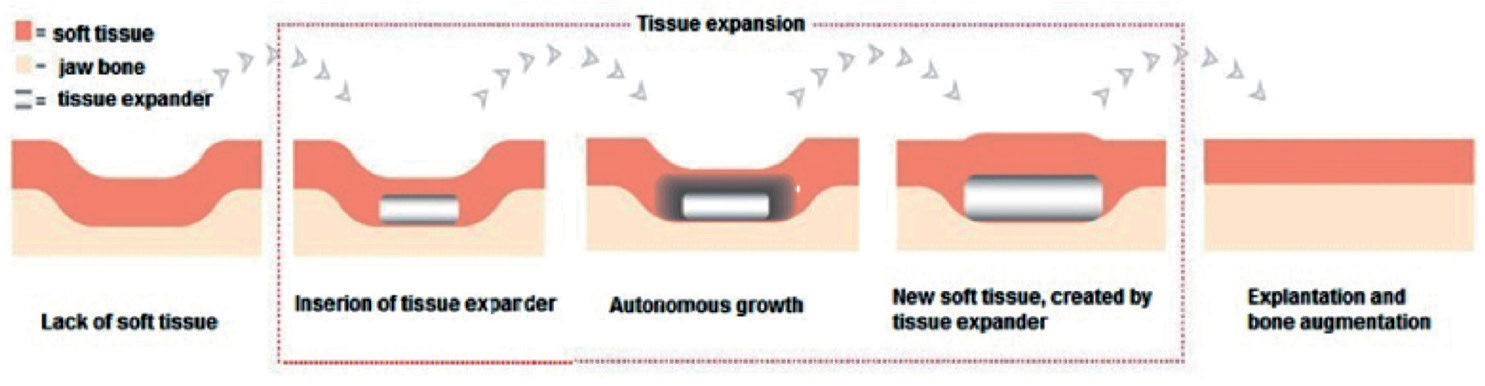
Fig. 3
The results of this retrospective study should be interpreted with caution, as it has certain limitations. The inclusion criteria for the analyzed CBCT scans, obtained from the same dental practice, were developed for the purposes of utilizing prefabricated grafts, and thus, our findings are not generalizable. As this was a pilot investigation, only areas with a free-end saddle were evaluated, thus excluding bounded saddle areas consisting of a missing second premolar and missing first molar. Therefore, further studies, also with larger sample sizes, are still needed.
Conclusion
Class V atrophy was the most common among the C&H classes that require bone augmentation in the right mandible and among females and the older age group. Virtual regeneration of Class V defects suggested the possibility of 3 clusters of bone grafts, depending on the number of missing teeth. Further studies are needed to evaluate the adaptation ratio between the virtual and actual grafts to conclude whether the grafts need minor or major shaping and modification at chairside before clinical application. Moreover, the current findings might help in developing a 2-step bone augmentation protocol: pre-augmentation STE technique, followed by regeneration with prefabricated grafts. This protocol could facilitate bone augmentation procedures for clinicians and decrease patient morbidity, especially in the case of complex defects.
Acknowledgments
This study was supported by Geistlich Pharma AG (Wolhusen, Switzerland). The authors would like to thank Dr. Birgit Schäfer from Geistlich Pharma for her valuable advices and assistance with this study. The authors would also like to thank Mr. Gianluca Vitrano and 3DMed (L’Aquila, Italy) for providing the software used in this study and for the technical support.
Competing interests
The authors report no conflict of interest related to this study.
Legends
Fig. 1 – Appearance of different Cawood and Howell classes on CBCT scans “Courtesy of Saavedra-Abril J A, Balhen-Martin C, Zaragoza-Velasco K, et al. Dental multisection CT for the placement of oral implants: Technique and applications. Radiographics 2010;30:1975-1991” Reference 16. Figure is used by permission of RSNA (Radiological Society of North America).
Fig. 2a – Creation and positioning of virtual bone grafts using OS3D 2.0 software.
Fig. 2b – Virtual placement of dental implants using the software as guidance for virtual graft reconstruction of a Cawood and Howell Class V.
Fig. 3 – Pre-augmentation soft-tissue expansion technique (with permission of osmed, Ilmenau, Germany).
References
| 1. | ↑ | Javed F, Ahmed HB, Crespi R, Romanos GE. Role of primary stability for successful osseointegration of dental implants: factors of influence and evaluation. → Interv Med Appl Sci. 2013 Dec;5(4):162–7. |
| 2. | ↑ | Rocchietta I, Fontana F, Simion M. Clinical outcomes of vertical bone augmentation to enable dental implant placement: a systematic review. → J Clin Periodontol. 2008 Sep;35(8 Suppl):203–15. |
| 3. | ↑ | Esposito M, Grusovin MG, Felice P, Karatzo-Poulos G, Worthington HV, Coulthard P. Interventions for replacing missing teeth: horizontal and vertical bone augmentation techniques for dental implant treatment. → Cochrane Database Syst Rev. 2009 Oct 7;(4):CD003607. doi: 10.1002/14651858. CD003607.pub4. |
| 4. | ↑ | Jensen SS, Terheyden H. Bone augmentation procedures in localized defects in the alveolar ridge: clinical results with different bone grafts and bone-substitute materials. → Int J Oral Maxillofac Implants. 2009;24 Suppl:218–36. |
| 5, 36. | ↑ | Asa’ad F, Rasperini G, Pagni G, Rios HF, Giannì AB. Pre-augmentation soft tissue expansion: an overview. → Clin Oral Implants Res. 2016 May;27(5):505–22. |
| 6. | ↑ | Moroni L, De Wijn JR, Van Blitterswijk CA. 3D fiber- deposited scaffolds for tissue engineering: influence of pores geometry and architecture on dynamic mechanical properties. → Biomaterials. 2006 Mar;27(7):974–85. |
| 7, 14. | ↑ | Laino L, Iezzi G, Piattelli A, Lo Muzio L, Cicciù M. Vertical ridge augmentation of the atrophic posterior mandible with sandwich technique: bone block from the chin area versus corticocancellous bone block allograft— clinical and histological prospective randomized controlled study. → Biomed Res Int. 2014;2014:982104. doi: 10.1155/2014/982104. |
| 8. | ↑ | Yeong WY, Chua CK, Leong KF, Chandrasekaran M. Rapid prototyping in tissue engineering: challenges and potential. → Trends Biotechnol. 2004 Dec;22(12):643–52. |
| 9. | ↑ | Ma PX. Biomimetic materials for tissue engineering. → Adv Drug Deliv Rev. 2008 Jan 14;60(2):184–98. |
| 10, 35. | ↑ | Asa’ad F, Pagni G, Pilipchuk SP, Giannì AB, Giannobile WV, Rasperini, G. 3D-printed scaffolds and biomaterials: review of alveolar bone augmentation and periodontal regeneration applications. → Int J Dent. 2016;2016:1239842. doi: 10.1155/2016/1239842. |
| 11. | ↑ | Venet L, Perriat M, Mangano FG, Fortin T. Horizontal ridge reconstruction of the anterior maxilla using customized allogeneic bone blocks with a minimally invasive technique—a case series. → BMC Oral Health. 2017 Dec 8;17(1):146. doi: 10.1186/s12903-017-0423-0. |
| 12. | ↑ | Metzger MC, Schön R, Tetzlaf R, Weyer N, Rafii A, Gellrich NC, Schmelzeisen R. Topographical CT-data analysis of the human orbital floor. → Int J Oral Maxillofac Surg. 2007 Jan;36(1):45–53. |
| 13. | ↑ | Sezer A, Altan L, Özdemir Ö. Multiple comparison of age groups in bone mineral density under heteroscedasticity. → Biomed Res Int. 2015;2015:426847. doi: 10.1155/2015/426847. |
| 15, 19. | ↑ | Cawood JI, Howell RA. A classification of the edentulous jaws. → Int J Oral Maxillofac Surg. 1988 Aug;17(4):232–6. |
| 16, 20. | ↑ | Rossetti PH, Bonachela WC, Rossetti LM. Relevant anatomic and biomechanical studies for implant possibilities on the atrophic maxilla: critical appraisal and literature review. → J Prosthodont. 2010 Aug;19(6):449–57. |
| 17, 21. | ↑ | Saavedra-Abril J, Balhen-Martin C, Zaragoza-Velasco K, Kimura-Hayama ET, Saavedra S, Stoopen ME. Dental multisection CT for the placement of oral implants: technique and applications. → Radiographics. 2010 Nov;30(7):1975–91. |
| 18, 31. | ↑ | Jacotti M, Barausse C, Felice P. Posterior atrophic mandible rehabilitation with onlay allograft created with CAD-CAM procedure: a case report. → Implant Dent. 2014 Feb;23(1):22–8. |
| 22, 29, 30. | ↑ | Reich KM, Huber CD, Lippnig WR, Ulm C, Watzek G, Tangl S. Atrophy of the residual alveolar ridge following tooth loss in an historical population. → Oral Dis. 2011 Jan;17(1):33–44. |
| 23. | ↑ | Solar P, Ulm CW, Thornton B, Matejka M. Sex-related differences in the bone mineral density of atrophic mandibles. → J Prosthet Dent. 1994 Apr;71(4):345–9. |
| 24. | ↑ | Kordatzis K, Wright PS, Meijer HJ. Posterior mandibular residual ridge resorption in patients with conventional dentures and implant overdentures. → Int J Oral Maxillofac Implants. 2003 May–Jun;18(3):447–52. |
| 25. | ↑ | Devlin H, Sloan P, Luther F. Alveolar bone resorption: a histologic study comparing bone turnover in the edentulous mandible and iliac crest. → J Prosthet Dent. 1994 May;71(5):478–81. |
| 26. | ↑ | Von Wowern N. Bone mineral content of mandibles: normal reference values—rate of age-related bone loss. → Calcif Tissue Int. 1988 Oct;43(4):193–8. |
| 27. | ↑ | Jones SJ, Arora M, Boyde A. The rate of osteoclastic destruction of calcified tissues is inversely proportional to mineral density. → Calcif Tissue Int. 1995 Jun;56(6):554–8. |
| 28. | ↑ | Winter CM, Woelfel JB, Igarashi T. Five-year changes in the edentulous mandible as determined on oblique cephalometric radiographs. → J Dent Res. 1974 Nov–Dec;53(6):1455–67. |
| 32. | ↑ | Lops D, Bressan E, Pisoni G, Cea N, Corazza B, Romeo E. Short implants in partially edentulous maxillae and mandibles: a 10 to 20 years retrospective evaluation. → Int J Dent. 2012;2012:351793. doi: 10.1155/2012/351793. |
| 33. | ↑ | Thoma DS, Cha JK, Jung UW. Treatment concepts for the posterior maxilla and mandible: short implants versus long implants in augmented bone. → J Periodontal Implant Sci. 2017 Feb;47(1):2–12. |
| 34. | ↑ | Grandi T, Svezia L, Grandi G. Narrow implants (2.75 and 3.25 mm diameter) supporting a fixed splinted prostheses in posterior regions of mandible: one-year results from a prospective cohort study. → Int J Implant Dent. 2017 Sep 8;3(1):43. doi: 10.1186/s40729-017-0102-6. |
| 37. | ↑ | Asa’ad F, Bellucci G, Ferrantino L, Trisciuoglio D, Taschieri S, Del Fabbro M. Preaugmentation soft tissue expansion: a report of four pilot cases. → Case Rep Dent. 2018 Apr 19;2018:3162617. doi: 10.1155/2018/3162617. |


Leave a Reply
Be the First to Comment!